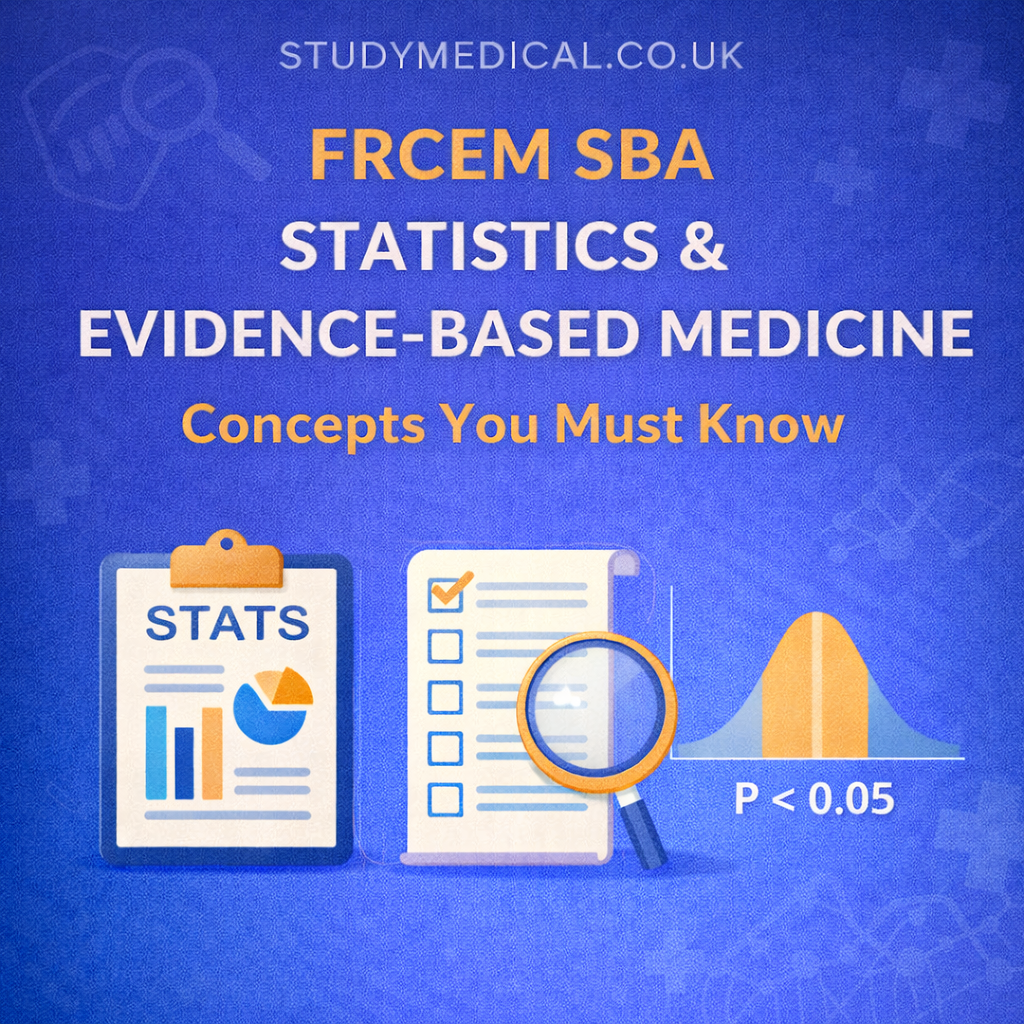
What Is Statistics & EBM and Why Does It Matter in the ED?
Evidence-Based Medicine (EBM) is the process of integrating best available research, clinical expertise, and patient values to make decisions. Medical statistics is the language EBM uses: it turns trial data, diagnostic accuracy studies, and risk scores into numbers you can actually apply in practice.
In the ED, you are constantly making probabilistic decisions: “How likely is PE really?”, “Is this troponin change clinically important?”, “Does this new sepsis drug meaningfully reduce mortality?” Being able to interpret sensitivity, specificity, likelihood ratios, confidence intervals, p-values and NNTs is part of safe senior decision-making and sits squarely under RCEM SLOs on research, managing data and making safe decisions. (RCEMCurriculum)
For the FRCEM SBA, statistics and EBM appear as data-heavy, high-discriminator questions that separate candidates who can genuinely interpret evidence from those who memorise guidelines.
How Statistics & EBM Appear in the FRCEM SBA Exam
Typical question angles:
- Calculating or interpreting:
- Sensitivity, specificity, PPV, NPV
- Positive and negative likelihood ratios
- Absolute vs relative risk reduction, NNT/NNH (CEBM)
- Choosing the best measure to describe risk or treatment effect.
- Interpreting:
- Confidence intervals and p-values
- Kaplan–Meier survival curves and hazard ratios
- Forest plots from meta-analyses
- Judging study design and validity:
- RCT vs cohort vs case-control vs diagnostic accuracy study
- Bias, confounding, randomisation, blinding
- Intention-to-treat vs per-protocol analysis (Research Guides)
Common formats:
- Short vignette + 2×2 table for a diagnostic test.
- Excerpt from a trial abstract (ARR, RRR, CI, p-value).
- Kaplan–Meier survival plot or forest plot image.
- “Which statement about this study is most accurate?” style questions.
Example scenario:
A new troponin assay is compared to a gold standard test for myocardial infarction. You are given a 2×2 table of true positives/negatives and false positives/negatives. The question asks for the positive likelihood ratio, or what happens to post-test probability if the test is positive.
Core Concepts You Must Know About FRCEM Statistics & EBM
Definitions & Key Criteria
- Sensitivity / Specificity
- Sensitivity: probability a test is positive when disease is present (TP / (TP+FN)).
- Specificity: probability a test is negative when disease is absent (TN / (TN+FP)).
- Predictive Values
- PPV: proportion of positive tests that truly have disease (TP / (TP+FP)).
- NPV: proportion of negative tests that are truly disease-free (TN / (TN+FN)).
- Strongly affected by prevalence.
- Likelihood Ratios
- LR+ = Sensitivity / (1 – Specificity)
- LR– = (1 – Sensitivity) / Specificity
- Used to move from pre-test to post-test probability; relatively independent of prevalence. (CEBM)
- Risk Measures
- Absolute Risk (AR), Relative Risk (RR), Odds Ratio (OR).
- Absolute Risk Reduction (ARR) = control event rate – experimental event rate.
- NNT = 1 / ARR (round up). (CEBM)
- Error, Power & Significance
- Type I error (α): false positive; usually set at 0.05.
- Type II error (β): false negative; (1 – β) = power.
- p-value: probability of observing data this extreme or more if the null hypothesis is true.
- 95% CI: range of values within which the true effect is likely to lie, if the study were repeated many times.
Assessment & Investigations (Study Design & Validity)
- Know study hierarchies:
- RCT > cohort > case-control > cross-sectional > case series for causality.
- Diagnostic accuracy studies for tests; systematic reviews/meta-analyses at the top when well-done.
- Understand internal vs external validity:
- Internal: bias, confounding, appropriate stats.
- External: how similar the study population is to your ED patients.
- Recognise types of bias:
- Selection, measurement, recall, publication, lead-time, length-time, etc.
- Be able to tell which study design is appropriate for:
- New stroke thrombolysis drug (RCT).
- Risk factors for AAA rupture (cohort/case-control).
- New test for PE (diagnostic accuracy study). (Research Guides)
Initial ED Management (Applying the Numbers)
- Use sensitivity/specificity and LRs to rule in or rule out disease:
- High sensitivity + negative test → rules out (SnNout).
- High specificity + positive test → rules in (SpPin).
- Use NNT/NNH to discuss benefit vs harm with patients when considering:
- Thrombolysis, anticoagulation, PCI timing, etc.
- Use CIs and p-values to judge:
- Is an effect real (statistically significant)?
- Is it clinically important (size and direction of effect)?
Red Flags and Pitfalls
- Statistically significant but clinically trivial differences.
- Wide CIs including no effect (RR or OR near 1.0) but with a p-value just <0.05.
- Over-interpreting subgroup analyses or post-hoc comparisons.
- Confusing odds ratios with relative risk, especially when event rates are high.
- Assuming a test with “95% sensitivity and specificity” is perfect in low-prevalence ED populations.
Special Topics Often Tested
- Kaplan–Meier curves and hazard ratios for time-to-event outcomes. (Research Guides)
- Forest plots from meta-analyses (understanding line of no effect, weight of studies).
- Non-inferiority trials (what margin was chosen; did the CI cross it?).
- Intention-to-treat vs per-protocol and why ITT is usually safer for estimating real-world benefit.
Common FRCEM SBA Traps Related to Statistics & EBM
- PPV/NPV vs Sensitivity/Specificity
- Trap: picking PPV when the question is about patients with disease, or sensitivity when the question is about test positives.
- Fix: Look at the denominator words: “of those with disease” → sensitivity; “of those who tested positive” → PPV.
- ARR vs RRR vs NNT
- Trap: thinking a large RRR (e.g. 50%) always means big benefit.
- Fix: Always calculate ARR first; then NNT. Tiny baseline risks can make impressive RRRs clinically unimportant.
- Odds Ratio vs Relative Risk
- Trap: interpreting OR as RR in a common outcome (e.g. OR 3.0 ≠ “three times the risk” when event rate is high).
- Fix: Remember OR approximates RR only when events are rare.
- Statistical vs Clinical Significance
- Trap: selecting an intervention because p=0.04 without noticing ARR is 0.5% and NNT is ~200.
- Fix: Ask: “Would this change my practice for this patient?”
- Misreading Graphs (Kaplan–Meier / Forest Plot)
- Trap: confusing survival probability with hazard, or misreading which side of 1.0 favours treatment.
- Fix: For forest plots, check: is the CI crossing 1? For Kaplan–Meier, higher line = better survival.
- Power and Non-Significant Results
- Trap: assuming p>0.05 proves no difference.
- Fix: Look at sample size and CI width; it may simply be under-powered.
High-Yield “Clinical Patterns” for Stats & EBM in the ED
Classic Exam-Style Scenario
A diagnostic test for pulmonary embolism is evaluated in 200 patients. You are given a 2×2 table and asked to calculate sensitivity, specificity or LR+, or to choose which test best rules out PE in low-risk patients.An RCT compares early vs delayed PCI in NSTEMI, giving ARR, RRR, NNT and 95% CIs. You must identify which statement correctly interprets these numbers.
Atypical / Tricky Scenario
- A non-inferiority trial of a new DOAC versus LMWH where the CI just crosses the non-inferiority margin.
- A Kaplan–Meier survival curve of mortality in septic shock comparing two vasopressors with an HR and CI.
- A forest plot of multiple trials of thrombolysis in stroke; you are asked which subgroup result is unreliable.
Dangerous Mimics (Concept Confusions)
- Correlation vs Causation
- Observational study showing association between ED crowding and mortality: exam asks whether this proves crowding causes death (it doesn’t).
- Screening Biases
- Lead-time and length-time bias making a screening test look more effective than it is.
- Confounding
- Sicker patients preferentially receiving a certain intervention, making it look harmful.
Being able to spot these “mimics” helps you pick the single best answer that reflects proper EBM reasoning.
How to Revise Statistics & EBM Efficiently for the FRCEM SBA
Use Question Banks First, Then Guidelines/Primers
- Start with a block of stats/EBM SBAs: sensitivity/specificity, LR, NNT, survival curves, etc.
- After doing 20–30 questions, read a concise EBM primer or the relevant sections in your favourite stats book/FOAMed resource to fill gaps, rather than reading stats cold. (FRCEM Ultrasound Courses)
Build Mini-Notes or Flashcards from Mistakes
For every stats question you get wrong, jot down:
- What the question tested (e.g. LR+ vs PPV).
- Why your answer was wrong (“I mixed up denominator – should have started with test positives”).
- One-liner rule:
- “LR+ = Sens / (1–Spec); LR– = (1–Sens)/Spec.”
- “NNT = 1/ARR; use absolute, not relative, risk reduction.”
Over a few weeks this becomes your personalised EBM formula sheet.
Mix Text-Based and Image-Based Questions
- Ensure you practise:
- 2×2 table calculations,
- Kaplan–Meier curves,
- Forest plots,
- Trial abstract excerpts.
- This mirrors the data-rich blueprint used in the real FRCEM SBA. (RCEM)
How StudyMedical Covers Statistics & EBM in Its FRCEM SBA Question Bank
StudyMedical’s FRCEM SBA bank includes a dedicated Statistics & Evidence-Based Medicine strand woven through clinical questions, mirroring how the real exam integrates numbers into real-world scenarios rather than testing stats in isolation.
You’ll find:
- Curriculum-mapped EBM questions targeting SLOs on research, data management and safe decision-making.
- Data-heavy SBAs featuring 2×2 tables, Kaplan–Meier curves, forest plots and abstract extracts.
- Step-by-step explanations that show not just the correct calculation, but how to think through it quickly under exam pressure.
- Revision modes for new, incorrect, and flagged questions so you can keep revisiting stats/EBM until it feels natural.
FAQs About Statistics & EBM in the FRCEM SBA
How often do statistics & EBM appear in the FRCEM SBA exam?
Regularly. The blueprint explicitly includes research methods and statistics, so expect multiple questions per paper, often embedded within clinical scenarios rather than standalone maths. (RCEM)
What’s the single most important thing to remember for the exam?
Don’t memorise formulas in isolation – learn to translate the clinical wording into the right denominator (with disease? test positive? in treatment group?) and pick the correct measure.
Are there must-know concepts or tools?
Yes: sensitivity, specificity, PPV/NPV, LR+/LR–, ARR, RRR, NNT/NNH, confidence intervals, p-values, basic study design, bias and how to read Kaplan–Meier/forest plots.
How many stats/EBM questions should I do before the exam?
Enough that a 2×2 table or survival curve feels boringly familiar. As a rule of thumb, aim for at least 50–100 focused EBM/statistics SBAs, plus whatever mixed questions you meet in system-based practice.
Key Takeaways: Statistics & EBM for FRCEM in 5 Bullet Points
- Know the core definitions: sensitivity, specificity, predictive values, LRs, ARR/RRR, NNT.
- Always identify the denominator when interpreting any probability or risk measure.
- Use CIs and effect size, not just p-values, to decide if a result is meaningful.
- Recognise common biases and study design limitations so you can judge whether to trust a result.
- Practise lots of data-heavy SBAs (tables, graphs, abstracts) so the exam format feels familiar.
Ready to Test Yourself on FRCEM Statistics & EBM?
Statistics and EBM can feel abstract, but in the FRCEM SBA they are high-yield, predictable and very learnable. Once you’ve seen enough patterns, a scary-looking table becomes an easy mark.
Create a “Statistics & EBM” revision session in the StudyMedical FRCEM SBA bank today and start turning numbers into easy exam marks – and better real-world decisions on shift.